By clicking “Accept All Cookies”, you agree to the storing of cookies on your device to enhance site navigation, analyze site usage, and assist in our marketing efforts. View our Privacy Policy for more information.
The tool for engineering orgs driving real AI transformation.
Most engineering tools sell dashboards, not answers. Quotient measures how AI and process changes affect delivery, ranks what's actually slowing your teams, and gives you the specific actions to take next.
Optimize AI impact
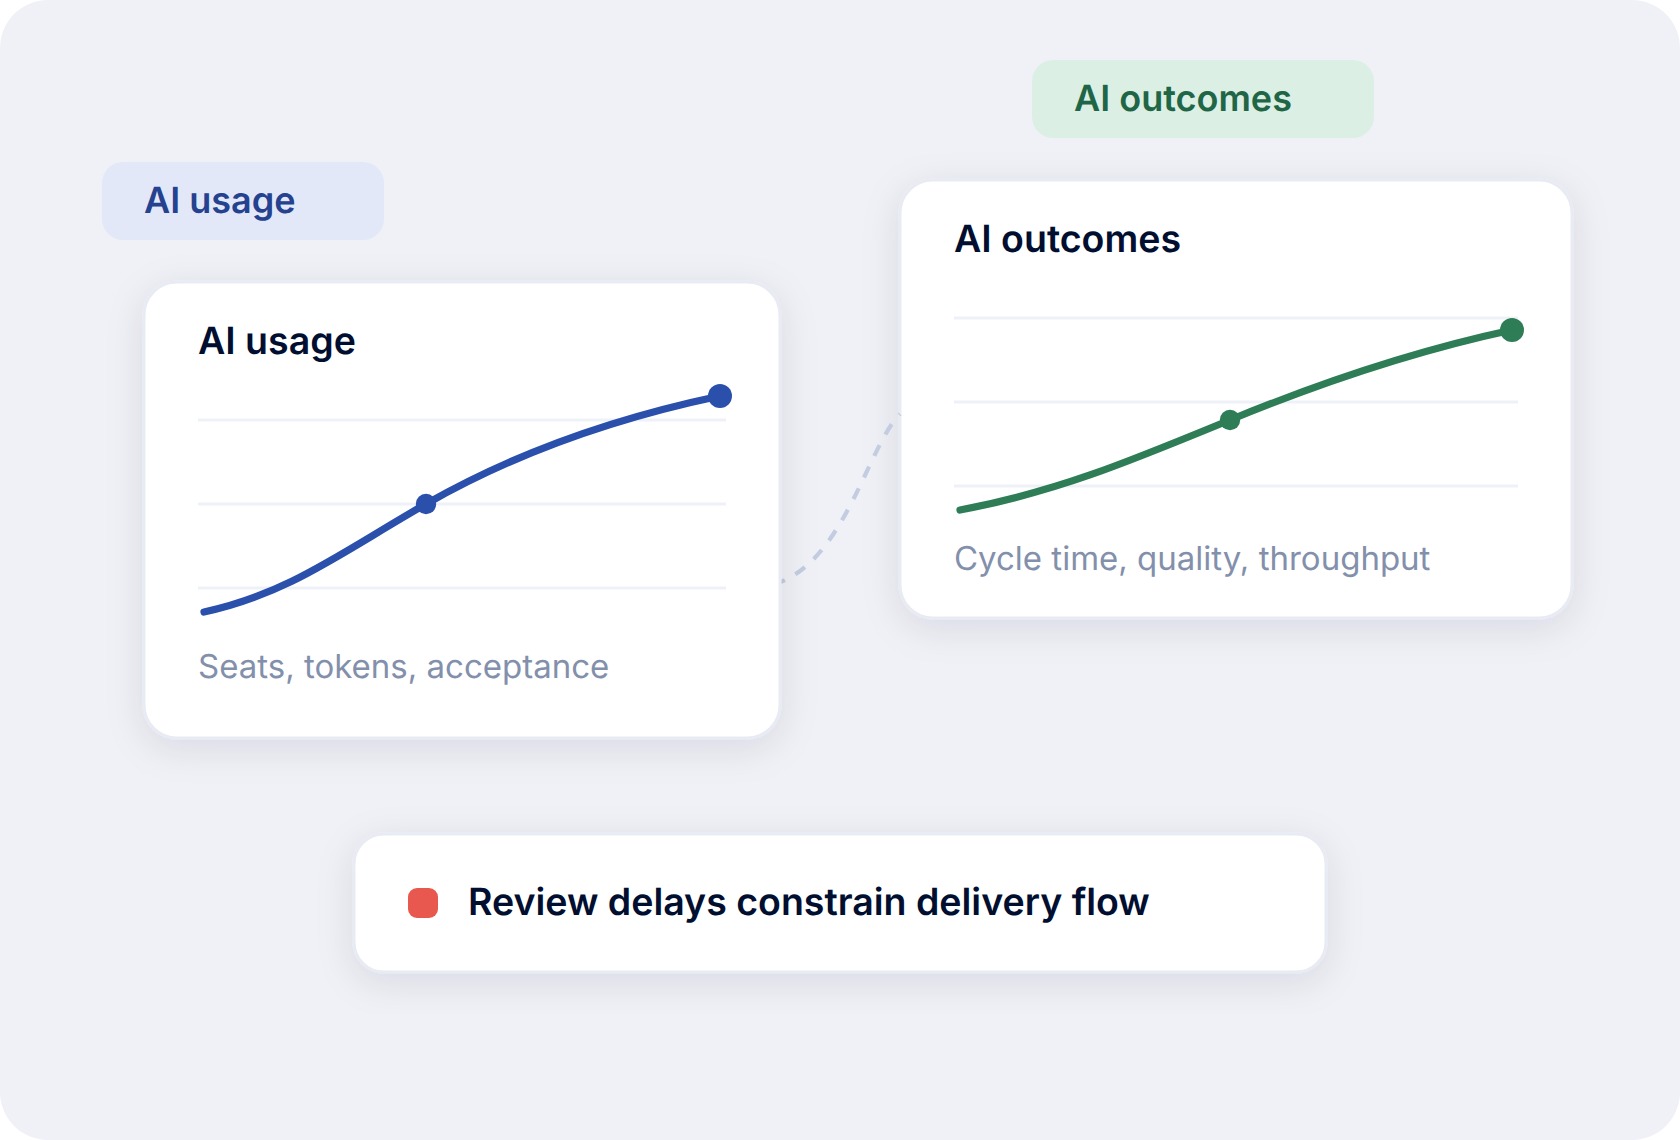
Usage data only tells you seats and tokens. Correlate AI adoption with delivery outcomes, so you can see whether speed, quality, and ease actually moved (and how).
Turn signals and insights into meaningful actions.
01Correlate AI usage to outcomesSee where AI adoption turned into delivery and where it did not, team by team, instead of counting seats and tokens. See AI Impact →
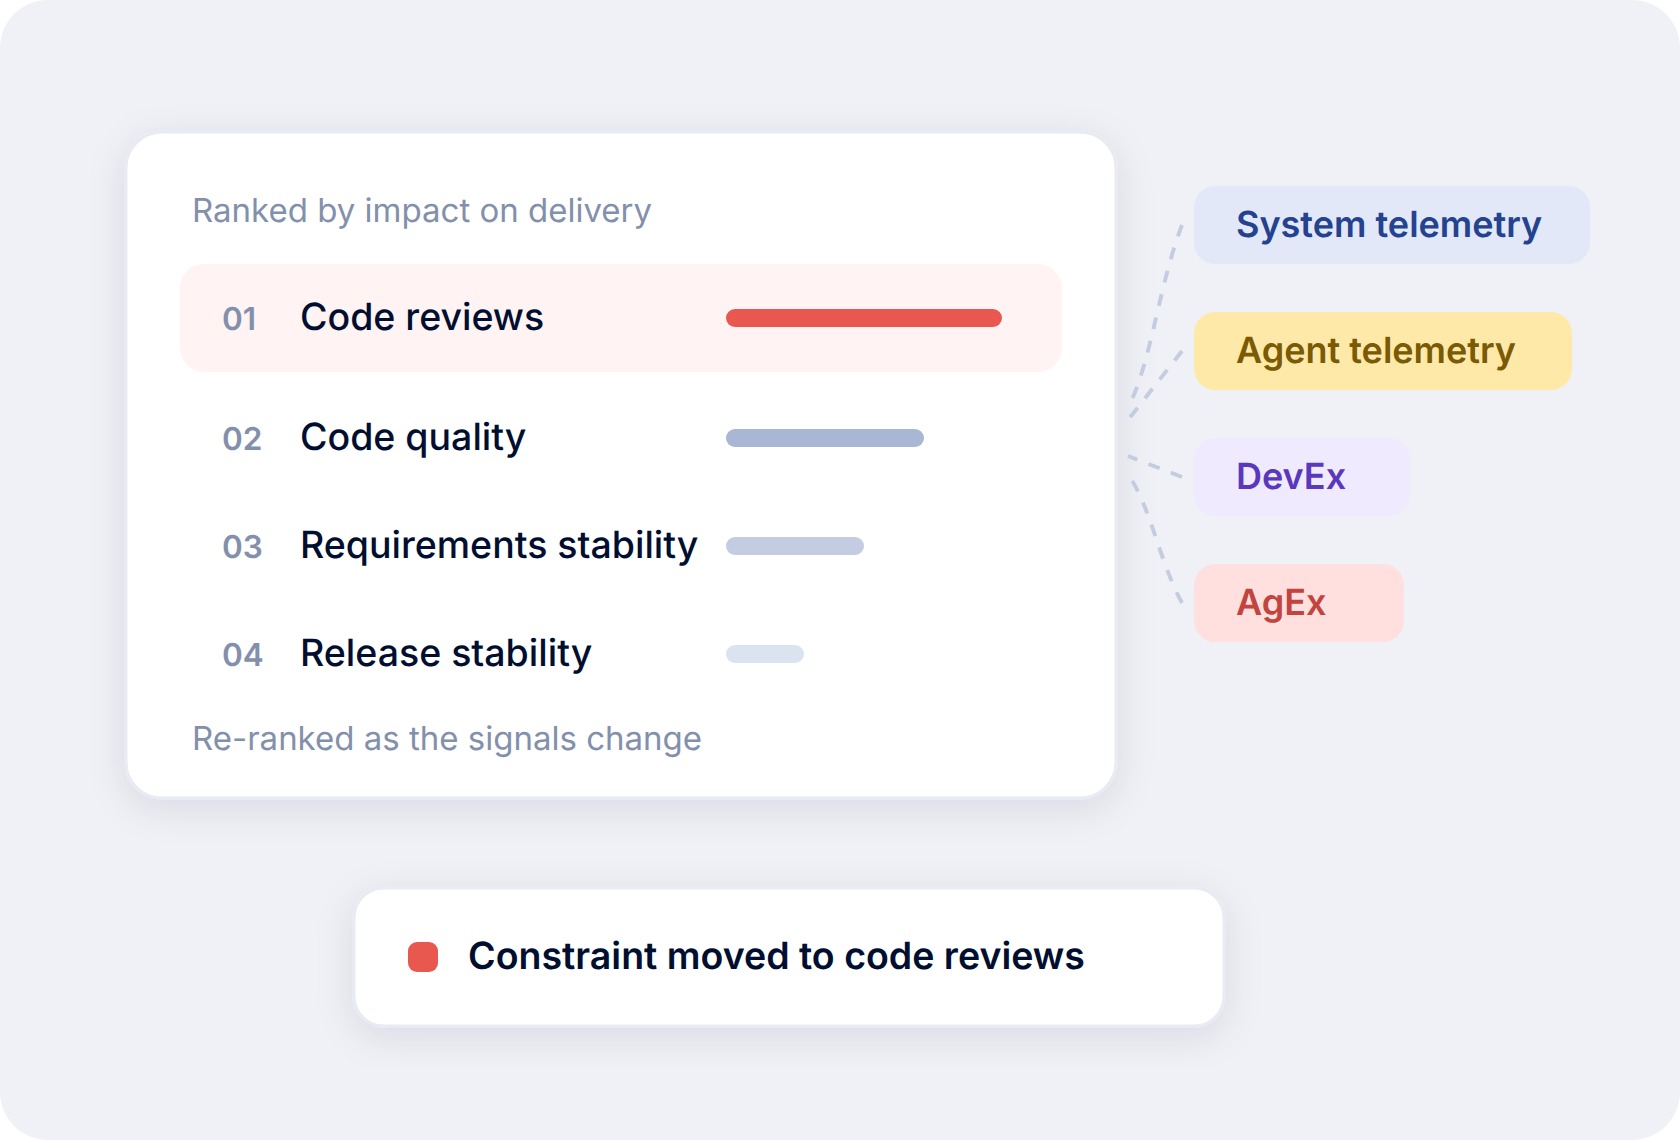
02Identify bottlenecks across teamsConstraints ranked by what they cost, with the teams each one is holding back, and re-ranked as the work changes. See Developer Productivity →
03Take AI-forward actionsEach action is traced to a published study and written for a pipeline where agents open pull requests too. See Developer Productivity →
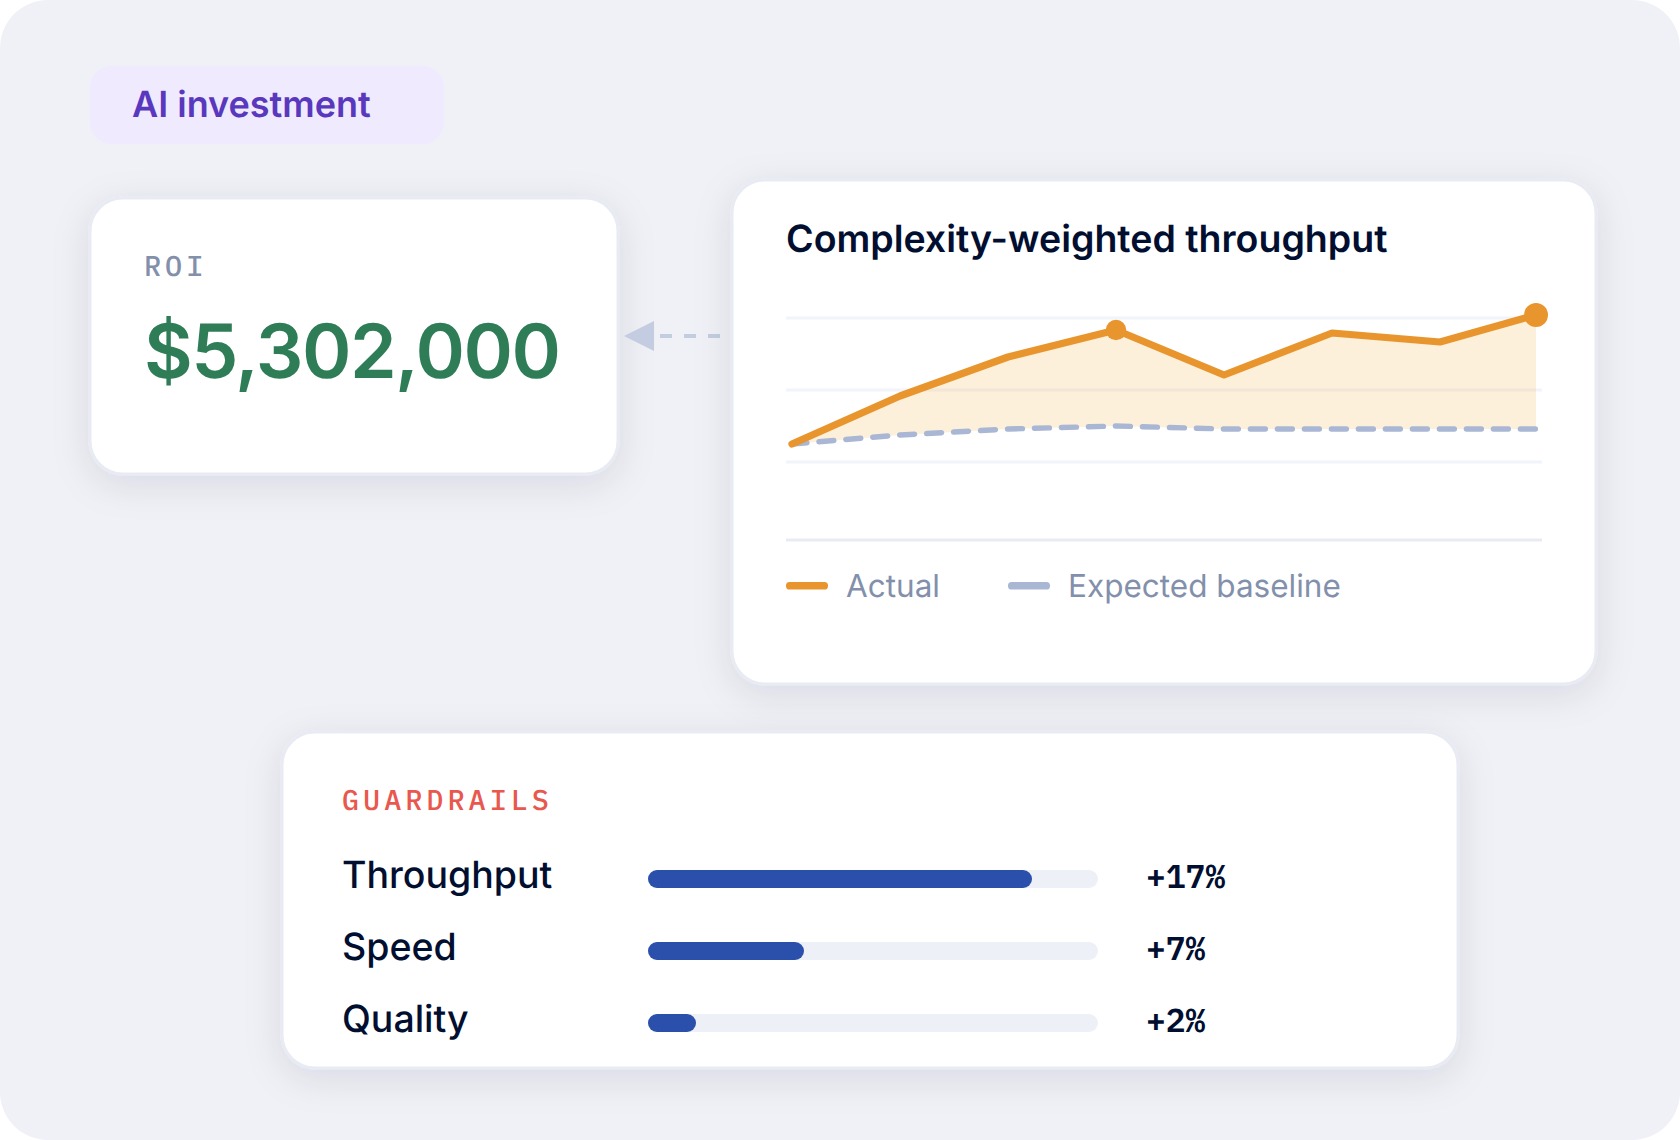
04Measure and optimize ROIQuotient keeps measuring after the change and turns the result into a dollar figure, with every assumption documented. See AI ROI →
The Quotient difference
What changes with Quotient.
Move from incomplete information to measurable change.
01Interpreting data
02Identifying bottlenecks
03Taking action
04Measuring impact
Without Quotient
Without QuotientSea of low-quality signalsDozens of dashboards giving incomplete or conflicting information.
Without QuotientGut feelingTackling processes without confidence that they are the core bottleneck.
Without QuotientOutdated practicesActions built for a human-only pipeline, which no longer move the bottleneck.
Without QuotientUnclear valueImpact measured with outdated techniques and a single source.
With Quotient
With QuotientA unified viewOne clear perspective, built from every source your teams already use.
With QuotientProven, prioritized bottlenecksResearch-backed analysis across data sources, ranked by what it costs you.
With QuotientAI-forward actionsActions that power a pipeline where humans and agents both ship.
With QuotientClear ROIA comprehensive, research-backed view of AI's impact, validated and defensible.
Build the Happiest, Highest-Performing Team Possible
See for yourself how Quotient builds the fastest path to the most productive engineering teams.
Bubble accelerates AI-native development with Quotient
+51%
AI adoption, 3 months
−32%
Cycle time
+19%
Code quality
Our teams now have a unified view of where AI is paying off, a clear plan to push it further, and tools to measure whether each experiment worked. That loop is what AI-native engineering actually looks like in practice.
AMAllison McMillanInterim VP of Engineering, Bubble
Rho strengthens developer experience using Quotient
+10%
AI tooling effectiveness
+15%
AI tooling satisfaction
+31%
Deep work
AI moves fast. What matters is knowing what's helping versus getting in the way. That clarity we get from Quotient tells us where to lean in, where to train, and where to stop forcing it.
Kargo used Quotient to improve engineering velocity
+33%
Requirements stability
+18.2%
Code reviews
+14%
Impact
Instead of focusing on fixing the data, we now focus on fixing problems that matter to the team, and that has allowed us to become a more efficient and productive group.
Take your first step toward meaningful change. Connect the systems your teams already use and get a ranked view of what is holding delivery back, with the action to take on each one.






.png)